
Statistics
Under Settings → Statistics you can see at a glance how many appointments your provider calendar had in a given period, how many of them were booked by customers, and how often appointments were attended or cancelled. The figures help answer questions such as: Is online booking worth it for us? Which appointment types receive the most bookings? What is our cancellation rate?
Select a period
At the top you define the period the statistics cover:
- From and To: month and year for the start and end.
- 12 M, 6 M, 3 M, 1 M: quick selection for the last twelve, six, three months or the last month.
- Appointment type: shows the figures for a specific appointment type only, for example viewings only.
The Statistics page with the period, quick selection and the four key figures looks like this:
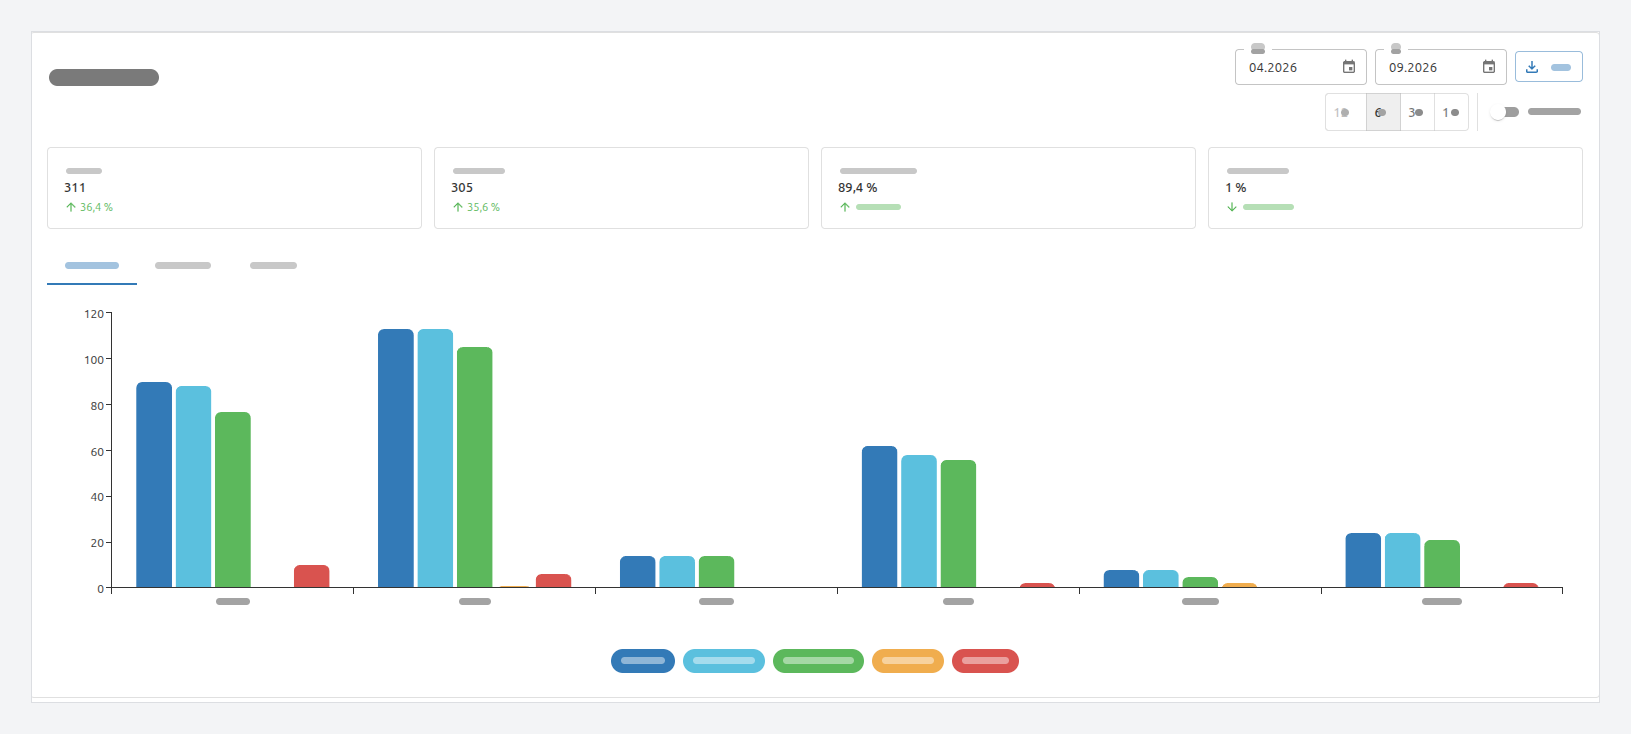
The four key figures
| Key figure | Meaning |
|---|---|
| Appointments | All appointments in your calendar for the selected period – both booked and manually entered ones. |
| Bookings | Appointments that customers booked via your booking links, your website, or an appointment invitation. |
| Attendance rate | Share of bookings for which the appointment took place. |
| Cancellation rate | Share of bookings that were cancelled by the customer or by you (see Cancel bookings). |
A dash instead of a number means: there were no bookings in the selected period from which a rate could be calculated.
Views
- Overview: the key figures as totals for the period.
- Monthly: the same period broken down by month, to identify trends – for example more bookings after embedding the widget on your website.
- Totals: the figures side by side per appointment type, to see which appointment types are booked most often.
Export as CSV
Use CSV to download the figures for the selected period as a spreadsheet, for example for Excel or your own analysis.
No data?